![]()


Earth Protect Blog
- Font size: Larger Smaller
- Hits: 4149
- 0 Comments
Rainforest loss slows
Deforestation rates in tropical countries dropped significantly during the first decade of the 21st century relative to the 1990s, reveals new data released by the Food and Agriculture Organization of the United Nations (FAO).
FAO figures show deforestation across 121 tropical countries averaged 9.34 million hectares per year between 2000 and 2010, down from 11.33 million hectares per year in the 1990s. The decline has accelerated since 2005 due Brazil's dramatic reduction of deforestation in the Brazilian Amazon, which peaked at 27,772 square kilometers in 2004 but is expected to come in at less than 8,000 for 2010. Overall Brazil's reduction in deforestation since 2005—which fell from 3.2 million hectares per year from 2000-2005 to 2.5 million hectares in 2005-2010—more than offset increases in forest clearing in other major forest countries including Democratic Indonesia (107 percent increase), Peru (94 percent), and Madagascar (36 percent) during the period.
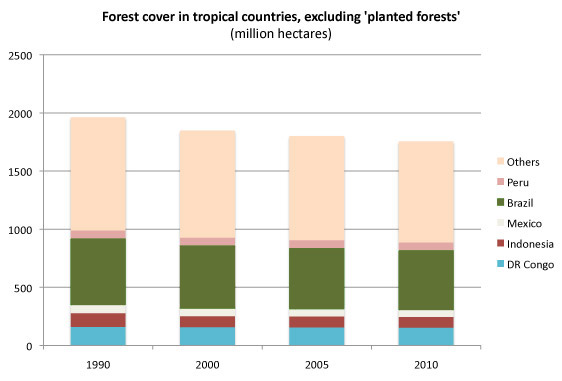 Other major countries that showed sharp reductions in deforestation between the first half of the decade and the second half of the decade include Mexico (37 percent drop), Laos (24 percent), Cambodia (22 percent), and Cameroon (14 percent). FAO estimates global deforestation fell from 16 million hectares per year in the 1990s to 13 million hectares per year in the past decade. Factoring in planted forests, the loss of rate cover fell from 8.3 million hectares per year to 5.2 million hectares, an area about the size of Costa Rica.
 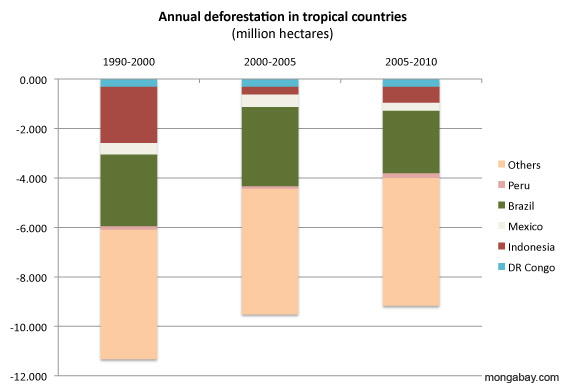 Loss of primary forest, the most carbon-dense and biologically diverse form of forest, declined by more than 40 million hectares over the past decade, primarily a result of first-time logging. Logging of primary does not necessarily result in deforestation, but does register a change under FAO's classification system. After Nigeria, which has almost no remaining old growth forest, South Korea had the highest annual rate of primary forest loss at nearly 4 percent per year over the past five years.
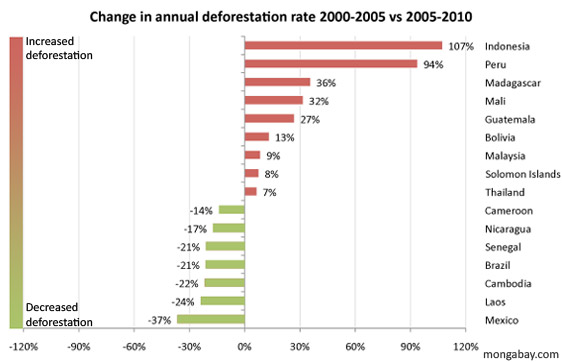
| Forest cover (excluding planted forests) | Annual change | ||||||
| 1000 ha | 1000 ha | 1000 ha | 1000 ha | 1000 ha | 1000 ha | ||
| 1990 | 2000 | 2005 | 2010 | 2000-2005 | 2005-2010 | change in rate | |
| Angola | 60836 | 59594 | 58973 | 58352 | -124.2 | -124.2 | - |
| Benin | 5751 | 5048 | 4796 | 4542 | -50.4 | -50.8 | 0.8% |
| Bhutan | 3034 | 3139 | 3193 | 3246 | 10.8 | 10.6 | -1.9% |
| Bolivia | 62775 | 60071 | 58714 | 57176 | -271.4 | -307.6 | 13.3% |
| Brazil | 569855 | 540767 | 524729 | 512104 | -3207.6 | -2525 | -21.3% |
| Burkina Faso | 6840 | 6190 | 5871 | 5540 | -63.8 | -66.2 | 3.8% |
| Cambodia | 12877 | 11467 | 10657 | 10025 | -162 | -126.4 | -22.0% |
| Cameroon | 24316 | 22116 | 20932 | 19916 | -236.8 | -203.2 | -14.2% |
| Central African Republic | 23201 | 22901 | 22753 | 22603 | -29.6 | -30 | 1.4% |
| Chad | 13099 | 12303 | 11906 | 11508 | -79.4 | -79.6 | 0.3% |
| Colombia | 62382 | 61254 | 60674 | 60094 | -116 | -116 | - |
| Congo | 22675 | 22505 | 22420 | 22336 | -17 | -16.8 | -1.2% |
| Costa Rica | 2269 | 2173 | 2269 | 2364 | 19.2 | 19 | -1.0% |
| Côte d'Ivoire | 10068 | 10067 | 10068 | 10066 | 0.2 | -0.4 | N/A |
| Cuba | 1711 | 2093 | 2309 | 2384 | 43.2 | 15 | -65.3% |
| DR Congo | 160307 | 157192 | 155635 | 154076 | -311.4 | -311.8 | 0.1% |
| Ecuador | 13817 | 11680 | 10688 | 9698 | -198.4 | -198 | -0.2% |
| Ethiopia | 14623 | 13214 | 12509 | 11785 | -141 | -144.8 | 2.7% |
| French Guiana | 8187 | 8117 | 8099 | 8081 | -3.6 | -3.6 | - |
| Gabon | 21970 | 21970 | 21970 | 21970 | 0 | 0 | - |
| Ghana | 7398 | 6034 | 5357 | 4680 | -135.4 | -135.4 | - |
| Guatemala | 4697 | 4115 | 3837 | 3484 | -55.6 | -70.6 | 27.0% |
| Guinea | 7204 | 6832 | 6642 | 6451 | -38 | -38.2 | 0.5% |
| Guinea-Bissau | 2216 | 2120 | 2071 | 2021 | -9.8 | -10 | 2.0% |
| Guyana | 15205 | 15205 | 15205 | 15205 | 0 | 0 | - |
| Honduras | 8136 | 6392 | 5792 | 5192 | -120 | -120 | - |
| India | 58223 | 58223 | 58223 | 58223 | 0 | 0 | - |
| Indonesia | 118545 | 95737 | 94158 | 90883 | -315.8 | -655 | 107.4% |
| Kenya | 3470 | 3370 | 3320 | 3270 | -10 | -10 | - |
| Laos | 17311 | 16433 | 15918 | 15527 | -103 | -78.2 | -24.1% |
| Liberia | 4921 | 4621 | 4471 | 4321 | -30 | -30 | - |
| Madagascar | 13461 | 12850 | 12548 | 12138 | -60.4 | -82 | 35.8% |
| Malawi | 3764 | 3370 | 3117 | 2872 | -50.6 | -49 | -3.2% |
| Malaysia | 20420 | 19932 | 19317 | 18649 | -123 | -133.6 | 8.6% |
| Mali | 14067 | 13226 | 12680 | 11960 | -109.2 | -144 | 31.9% |
| Mexico | 70291 | 65693 | 63184 | 61599 | -501.8 | -317 | -36.8% |
| Mozambique | 43340 | 41150 | 40055 | 38960 | -219 | -219 | - |
| Myanmar | 38824 | 34172 | 32472 | 30785 | -340 | -337.4 | -0.8% |
| Nepal | 4777 | 3858 | 3593 | 3593 | -53 | 0 | -10.0% |
| Nicaragua | 4514 | 3814 | 3390 | 3040 | -84.8 | -70 | -17.5% |
| Nigeria | 16983 | 12821 | 10740 | 8659 | -416.2 | -416.2 | - |
| Panama | 3779 | 3325 | 3248 | 3172 | -15.4 | -15.2 | -1.3% |
| Papua New Guinea | 31460 | 30051 | 29345 | 28640 | -141.2 | -141 | -0.1% |
| Paraguay | 21134 | 19332 | 18432 | 17534 | -180 | -179.6 | -0.2% |
| Peru | 69893 | 68498 | 67988 | 66999 | -102 | -197.8 | 93.9% |
| Philippines | 6268 | 6790 | 7051 | 7313 | 52.2 | 52.4 | 0.4% |
| Senegal | 9143 | 8592 | 8266 | 8009 | -65.2 | -51.4 | -21.2% |
| Sierra Leone | 3111 | 2914 | 2813 | 2711 | -20.2 | -20.4 | 1.0% |
| Solomon Islands | 2280 | 2240 | 2214 | 2186 | -5.2 | -5.6 | 7.7% |
| Suriname | 14763 | 14763 | 14763 | 14745 | 0 | -3.6 | - |
| Tanzania | 41345 | 37262 | 35215 | 33188 | -409.4 | -405.4 | -1.0% |
| Thailand | 16881 | 15893 | 15454 | 14986 | -87.8 | -93.6 | 6.6% |
| Uganda | 4717 | 3837 | 3398 | 2937 | -87.8 | -92.2 | 5.0% |
| Venezuela | 52026 | 49151 | 47713 | 46275 | -287.6 | -287.6 | - |
| Viet Nam | 8396 | 9675 | 10283 | 10285 | 121.6 | 0.4 | -99.7% |
| Zambia | 52740 | 51074 | 50241 | 49406 | -166.6 | -167 | 0.2% |
| Zimbabwe | 22010 | 18774 | 17151 | 15516 | -324.6 | -327 | 0.7% |
Note: FAO data is based largely on self-reporting by countries. So countries lack adequate systems for tracking changes in forest cover.
Global Forest Resources Assessment 2010
Comments
-
Please login first in order for you to submit comments
